
Home / Reports
Analysis and reports
Remark Quick Stats, included with the software, tabulates surveys, grades tests and produces ready-made reports.
Reports can be customised with your own headings, colours, fonts and charts. For tests, grading is automatic: define the answer key, grade scale, learning objectives and benchmark scores, and the software produces item analysis, frequency distributions and student grades. A grade report for each student can be printed.
Sample reports
Seven of the reports produced by Remark Quick Stats. Click a report, then use the next and previous buttons.
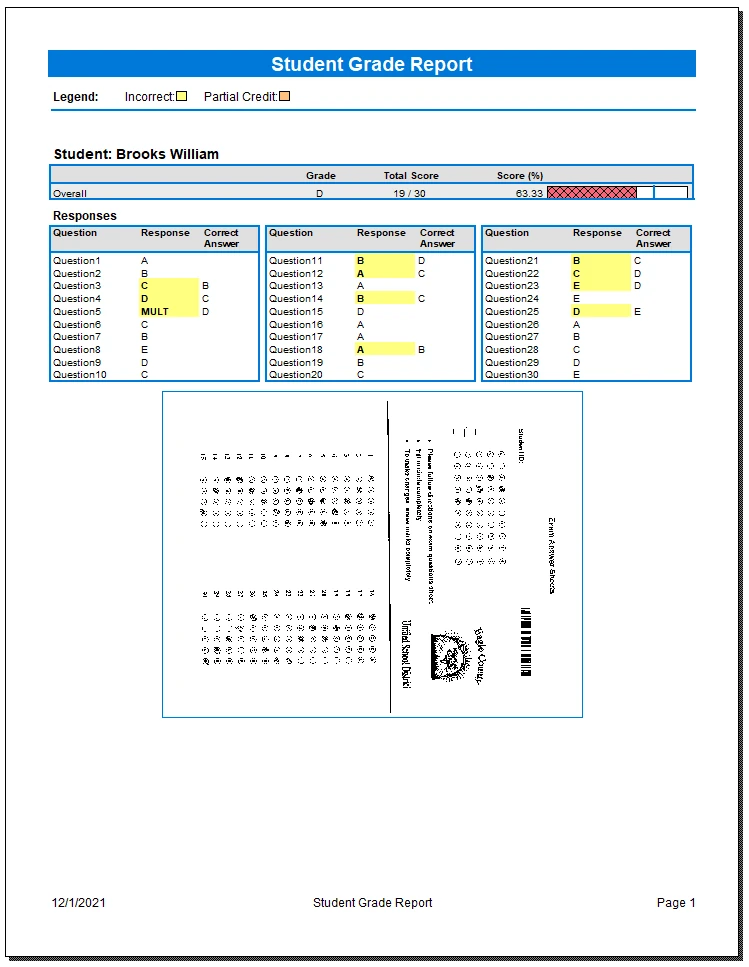
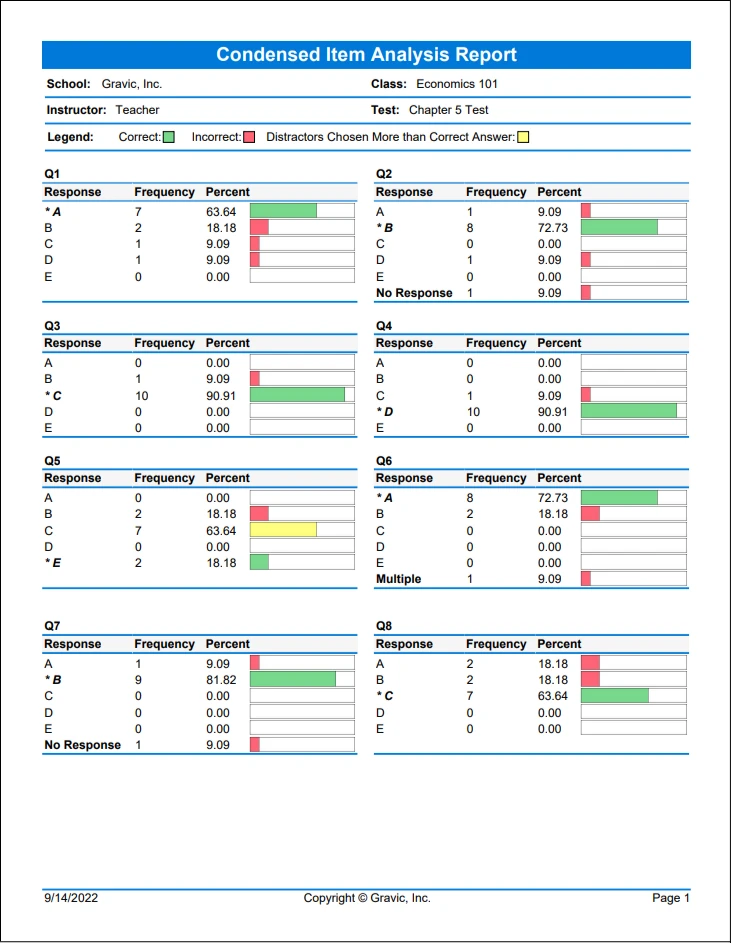
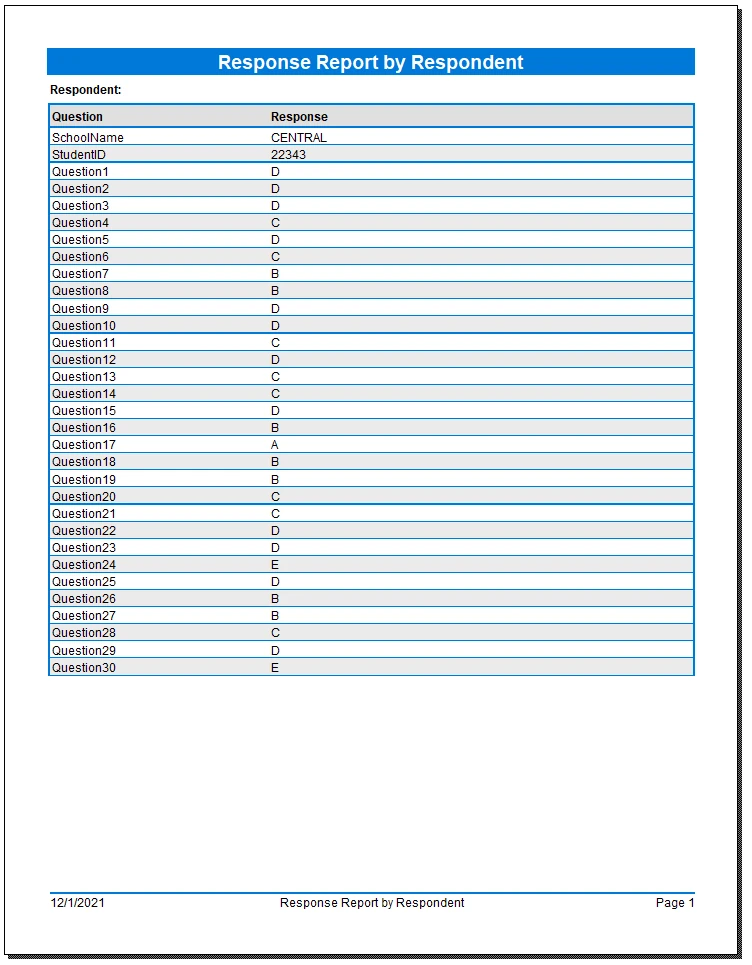
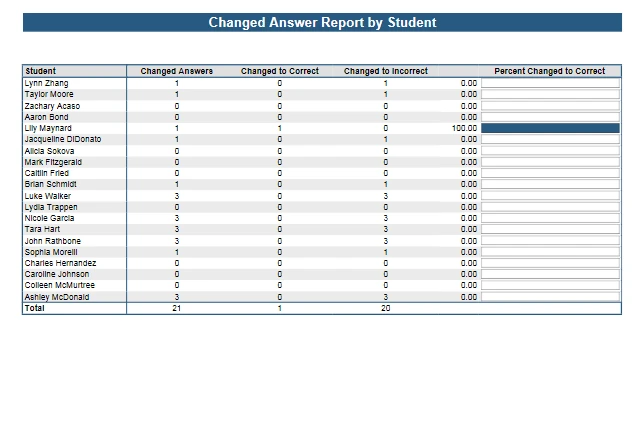
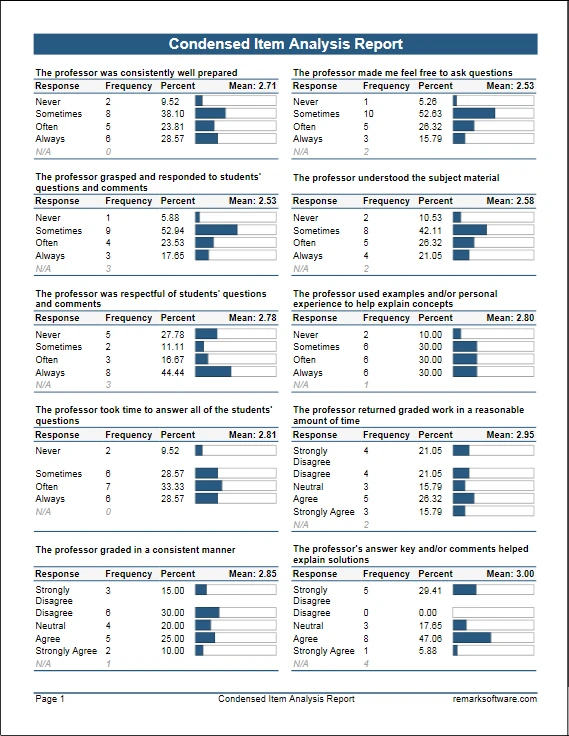
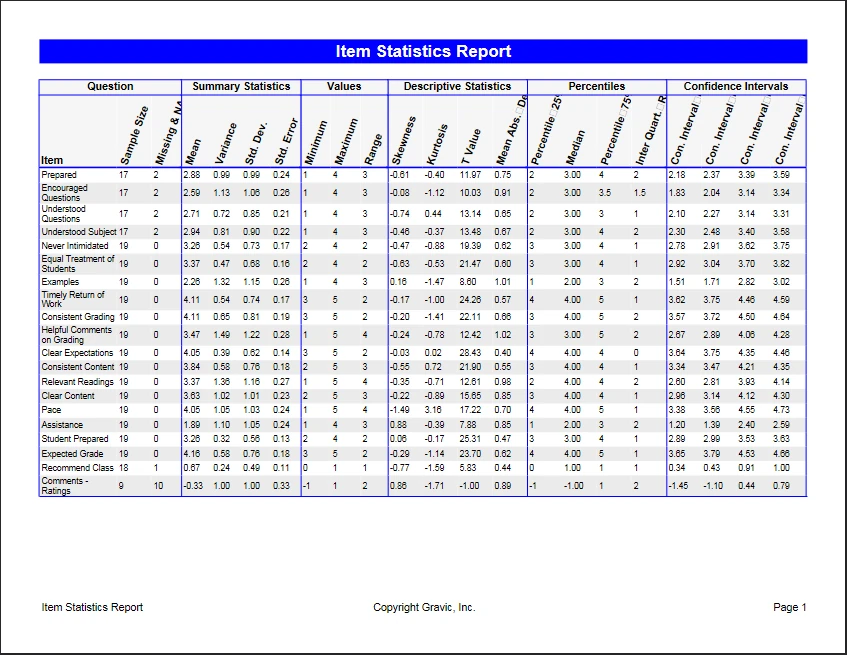
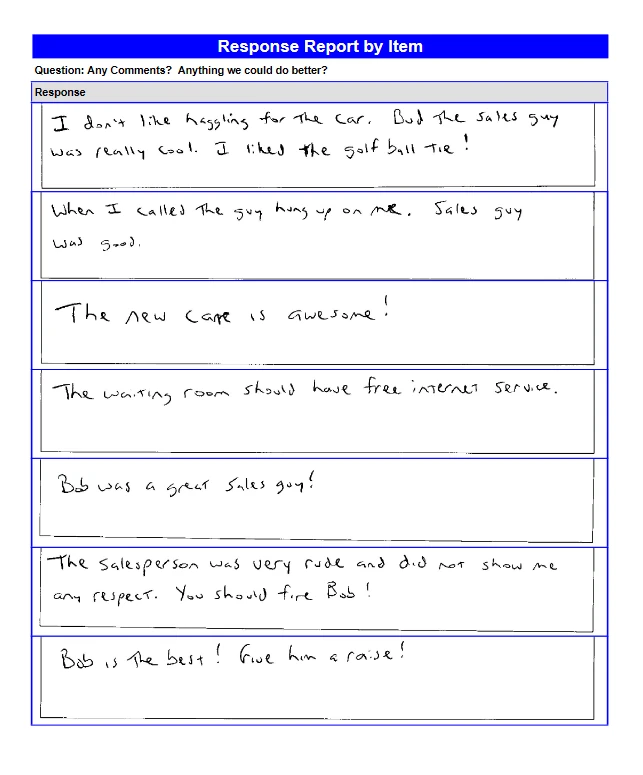
Images: Gravic, Inc.
Test grading
- Easy grading
- Load the answer key together with the answer sheets and get the reports in one step.
- Grading wizard
- Multiple-answer questions, grade scales, question points, learning objectives and comparison with earlier scores.
- Multiple test versions
- Grade different booklets of the same test with different answer keys.
- Scaled scores
- Convert total or percent scores using an external lookup table.
Test reports
- Student statistics
- Comparative grade
- Class frequency distribution
- Test statistics
- Student response
- Condensed test
- Demographic grade
- Item analysis
Statistics calculated
- Per item: mean, variance, standard deviation, standard error, minimum, maximum, range, median, skewness, kurtosis, t-value, percent, confidence interval, p-values, point biserial.
- Per student: total score, raw score, grade, number correct, incorrect and blank.
- Per test: minimum, maximum, mean, range, percent scores, median, variance, standard deviation, confidence intervals, KR-20, KR-21, Cronbach's alpha.
Survey analysis
- One-click standard reports
- Produce the ready-made reports immediately.
- Survey wizard
- Question groups for averages, comparison with targets and question weighting.
- Compare and filter
- Compare answers across data subsets; filter by any criterion, for example by conference session.
- "Not applicable" answers
- Can be excluded from statistics while still counted separately.
- Handwritten comments
- The response report lists all handwritten answers in one place.
Survey reports
- Item analysis
- Item statistics
- Crosstabulation
- Comparative item
- Question mean
- Group analysis
- Response
The batch report wizard prints or exports several reports in one job and can split them automatically by up to three fields in your data.
Try it with your own form
We run demos over a remote session: send us your form, we prepare its template and read it together.